.svg)
Marketing Analytics Dashboards: Turning Data Into Clear Insights
An overview of marketing analytics dashboards and how they help organizations organize data, monitor marketing performance, and turn complex metrics into clear insights.
Digital marketing generates a large amount of data across websites, advertising platforms, social media channels, and customer management systems. While this data can provide valuable insights, interpreting it effectively can become difficult when information is scattered across multiple tools.
To address this challenge, many organizations use marketing analytics dashboards — centralized visual interfaces that combine data from different sources and present it in a structured and accessible format.
By organizing key performance indicators and marketing metrics in one place, dashboards help teams observe trends, evaluate performance, and better understand how marketing activities influence results.
What Is a Marketing Analytics Dashboard?
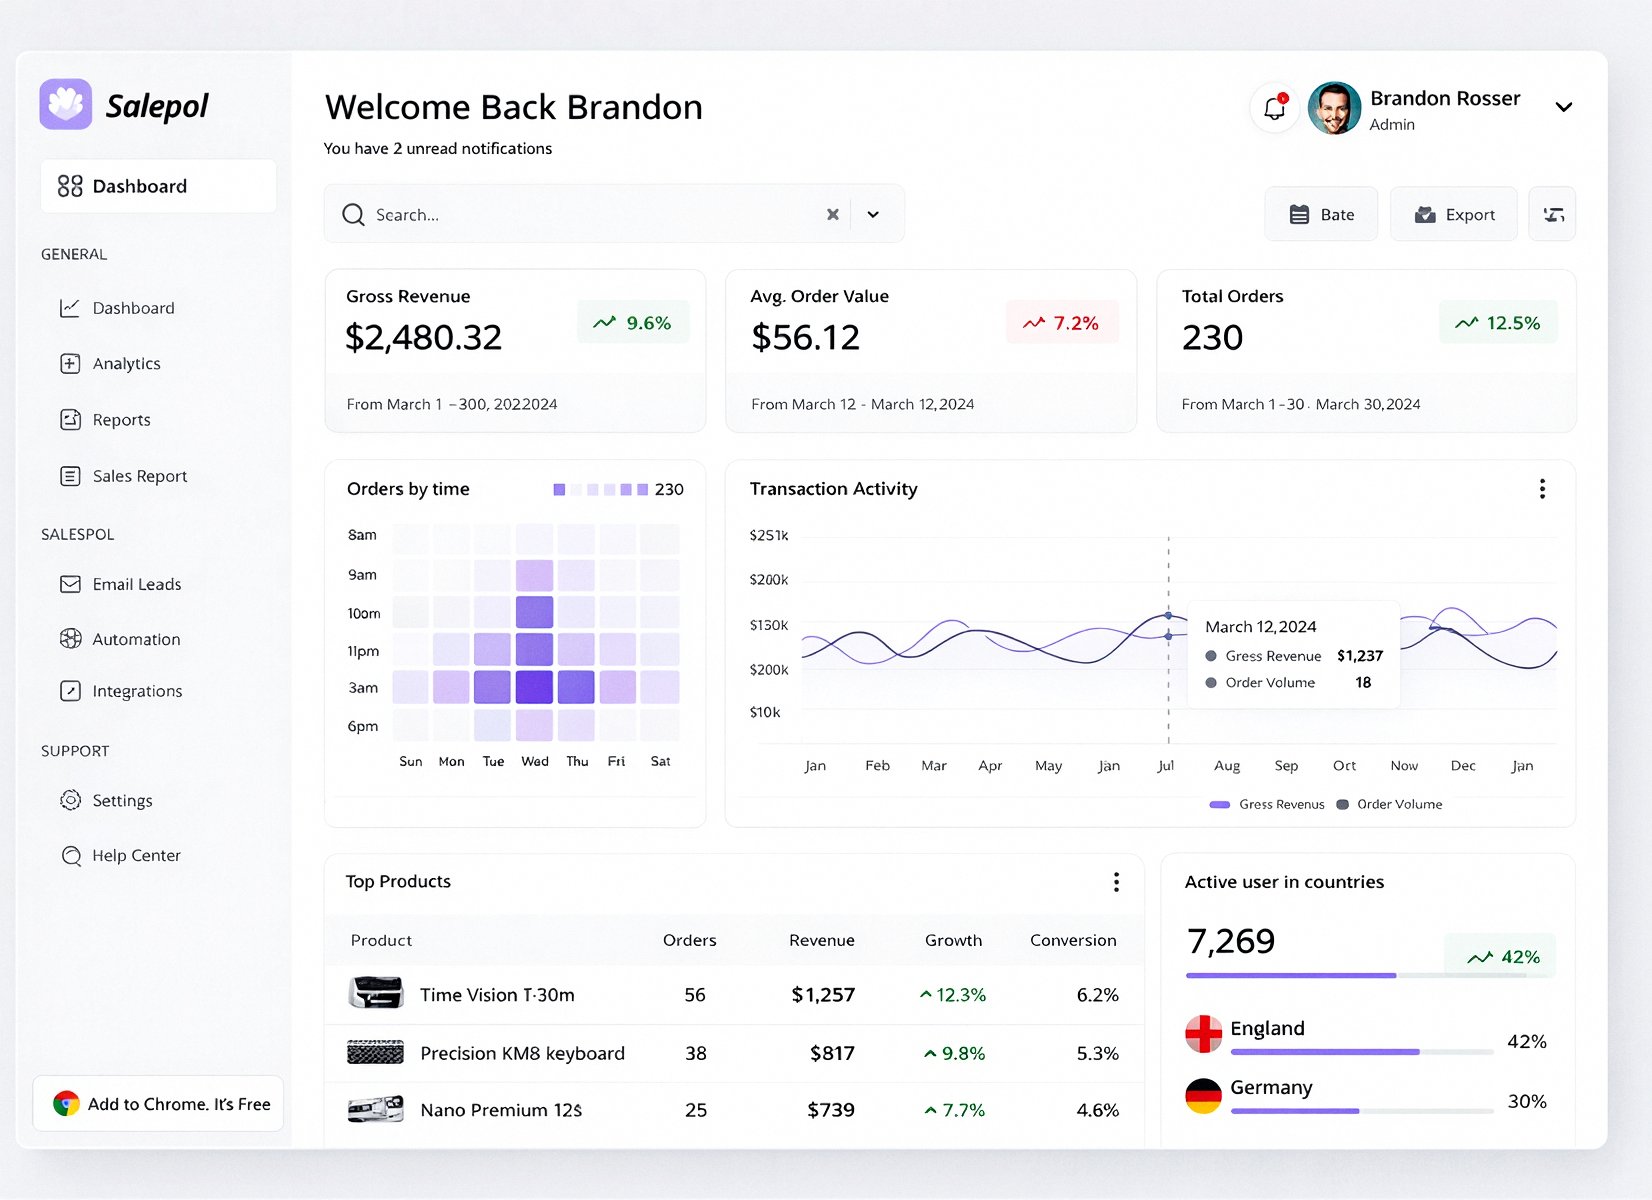
A marketing analytics dashboard is a visual reporting interface that aggregates data from various marketing platforms and displays it through charts, graphs, and summary metrics.
Rather than reviewing separate reports from different tools, teams can access a single environment that provides an overview of performance across multiple channels.
Dashboards often display metrics such as traffic levels, campaign performance, engagement indicators, and conversion trends. This allows organizations to quickly observe patterns and monitor how marketing activities evolve over time.
Why Organizations Use Marketing Dashboards
Marketing dashboards help simplify complex information and make performance data easier to interpret.
Some of the key benefits include:
- Centralized Data Visibility
Dashboards combine information from different platforms into one place, reducing the need to navigate multiple reporting environments. - Faster Performance Monitoring
Teams can quickly review key indicators and identify changes in performance. - Improved Decision Support
When metrics are clearly presented, it becomes easier to evaluate marketing initiatives and identify opportunities for improvement. - Shared Understanding Across Teams
Dashboards allow different departments to observe the same performance indicators, which can improve coordination between marketing, product, and leadership teams.
Common Metrics Displayed in Marketing Dashboards
Although dashboards vary depending on the needs of each organization, several types of metrics commonly appear in marketing analytics dashboards.
Traffic and Audience Metrics
These indicators help organizations understand how users arrive at digital platforms and how audience size evolves over time.
Examples include website visits, session duration, and traffic sources.
Engagement Metrics
Engagement indicators measure how users interact with content and communication channels. Examples include click rates, time spent on content, and interaction with digital experiences.
Conversion Metrics
Conversion indicators show how many users complete desired actions, such as signing up for a service, requesting information, or making a purchase.
Retention Indicators
Some dashboards also include metrics related to long-term engagement, such as returning visitors or repeat customer activity.
Designing Effective Dashboards
Effective dashboards are designed to communicate insights clearly rather than simply displaying large volumes of data.
Organizations often focus on several principles when creating dashboards:
- Clarity
Metrics should be easy to interpret and directly connected to business objectives. - Consistency
Dashboards should follow consistent definitions and measurement frameworks to ensure that data remains comparable over time. - Relevance
Only the most important indicators should be included, helping teams focus on meaningful insights. - Accessibility
Dashboards should be easy for different stakeholders to access and understand.
Dashboards and Continuous Analysis
Marketing analytics dashboards are not only used for monitoring results but also for supporting continuous analysis.
By observing patterns over time, organizations can identify trends, detect potential issues, and explore opportunities for improvement. For example, changes in traffic patterns or engagement levels may prompt teams to review specific campaigns or communication strategies.
Dashboards therefore serve as an ongoing reference point for understanding how marketing activities evolve.
The Growing Role of Data Visualization
As marketing data becomes increasingly complex, visualization tools play an important role in making information accessible. Data visualization allows teams to interpret patterns quickly and communicate insights more effectively.
Charts, graphs, and summary indicators can help transform raw numbers into meaningful insights that support strategic discussions and planning.
Conclusion
Marketing analytics dashboards help organizations transform large volumes of data into structured insights. By combining information from multiple platforms and presenting it in a clear visual format, dashboards support performance monitoring and informed decision-making.
As digital environments continue to generate more data, structured analytics dashboards are likely to remain an important tool for understanding marketing performance.

© 2026 Inventello Limited. All rights reserved.
FLAT/RM A 12/F ZJ 300 300LOCKHART RD WAN CHAIHONG KONG
Strategy • Acquisition • Conversion • Retention • Analytics
• Strategy • Acquisition • Conversion • Retention • Analytics
• Strategy • Acquisition • Conversion • Retention • Analytics